
April 11, 2023
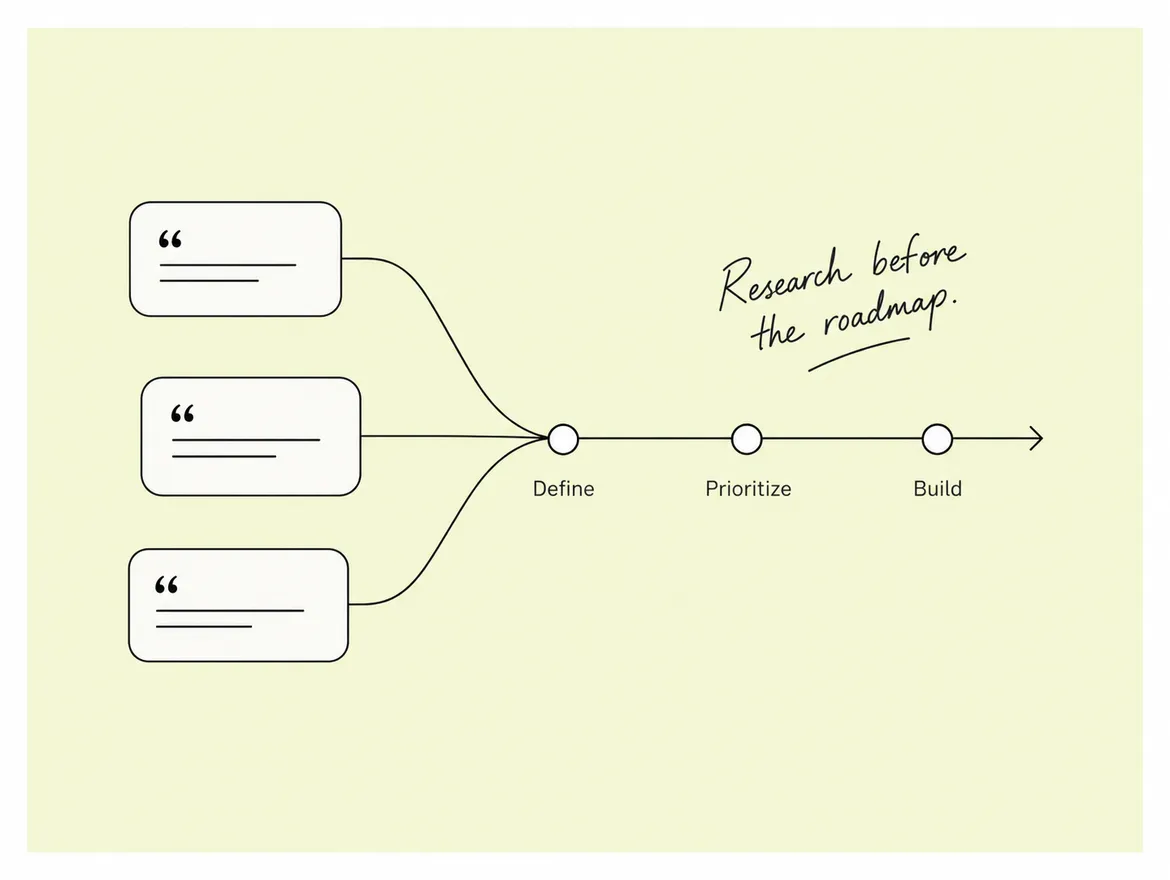
PART 1: Why User Research Is Critical for a Product Roadmap: Znap Cash Case Study Design Process
Read Full

A performance project usually starts with a score and ends with an argument. Someone runs a test, gets a number in the red, and the team spends a fortnight compressing images while the real cost sits in a third-party tag nobody wants to remove. The score moves a little. Nobody can say whether anything got faster for an actual visitor, because nobody measured one.
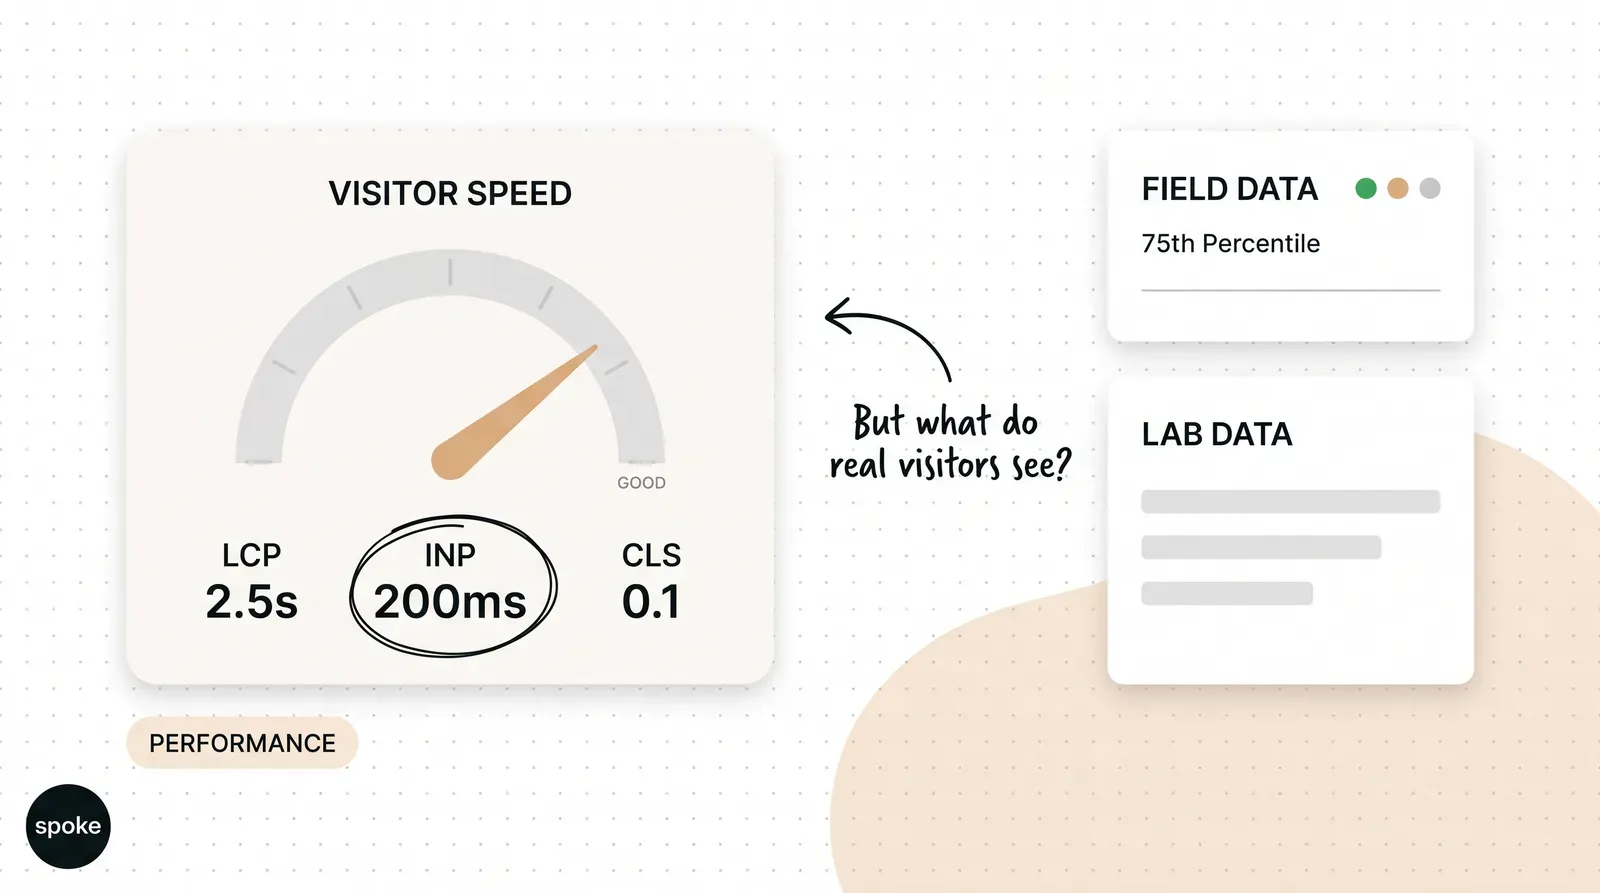
The distinction that settles most performance arguments is between lab data and field data. A lab test runs your page once, on a simulated device, on a simulated connection. Field data records what happened to people who actually visited. The two routinely disagree, and only one of them describes your customers.
Google's Web Vitals documentation is direct about this. It says only field measurement captures the complete picture, because performance varies with device, network and user interaction, and that lab data is useful during development and for catching regressions but is not a substitute. It adds a detail worth knowing before you plan any work: lab tools such as Lighthouse cannot measure INP at all, because there is no user input to respond to, and use Total Blocking Time as a proxy instead.
So a red Lighthouse score is a hypothesis, not a finding. Treat it as a list of things worth checking in the field, not a list of things to fix. The same discipline applies to any web design and development project, though it bites hardest where a team is optimising against a number rather than a visitor.
The same documentation gives the three metrics and their good thresholds. Largest Contentful Paint measures loading and should occur within 2.5 seconds of the page starting to load. Interaction to Next Paint measures interactivity and should be 200 milliseconds or less. Cumulative Layout Shift measures visual stability and should stay at 0.1 or less.
The part teams miss is how those are assessed. Google recommends measuring at the 75th percentile of page loads, segmented across mobile and desktop, and says a page passes only when it meets all three targets at that percentile. A good average hides a failing quarter of your visitors, and that quarter is disproportionately on older phones and slower connections.
Desktop scores are easier to move and easier to look at, because that is the device the team works on. The segmentation exists because the two populations behave differently. Check both before deciding where the work goes, and expect the mobile figure to be the one setting your result.
LCP is the metric most sites fail, and it is also the one that decomposes cleanly. Google’s guidance on optimising LCP splits it into four parts with recommended shares: time to first byte at roughly 40 per cent, resource load delay under 10 per cent, resource load duration at roughly 40 per cent, and element render delay under 10 per cent. It is careful to say these are guidelines rather than strict targets, and that the subparts only mean anything relative to each other, so it advises against turning them into absolute time budgets.
That breakdown is the most useful thing in any performance project, because it tells you which fortnight of work is wasted. If your time to first byte is most of your LCP, compressing the hero image will not save you. If the image download dominates, no amount of script deferral will help.
The same guidance is specific about images: make the LCP image discoverable in the initial HTML so the preload scanner finds it early, give it a high fetch priority but not more than a couple of images, never lazy-load it, and shrink it through sizing, modern formats and compression. On render-blocking resources it asks you to reduce stylesheet size so it loads faster than the LCP resource, and to avoid synchronous scripts in the head.
Below is the LCP breakdown with the usual cause of each part and the practical ceiling on fixing it. The final row is a reminder that interactivity is a separate measurement with separate tooling.
|
Where time goes |
Share of LCP |
Usual cause |
The limit on fixing it |
|---|---|---|---|
|
Time to first byte |
About 40 per cent |
Hosting, redirects, server distance |
Largely outside your control on a hosted platform |
|
Resource load delay |
Under 10 per cent |
Image discovered late, or lazy-loaded |
Cheap to fix and usually already correct |
|
Resource load duration |
About 40 per cent |
Oversized or unoptimised hero image |
Bounded by how small the image can go |
|
Element render delay |
Under 10 per cent |
Render-blocking CSS or scripts in the head |
Third-party tags are rarely yours to defer |
|
Interaction delay |
Measured by INP, not LCP |
Long tasks from scripts |
Needs field data; lab tools cannot measure it |
The pattern in the last column is that the two largest shares are the two hardest to move. Server time on a hosted platform is mostly not yours, and an image can only get so small before it looks wrong. That is not a reason to skip the work. It is a reason to size the expectation before the project starts.
Webflow's own guidance on site speed names large images as the most common reason for slow loading. It recommends vector graphics where feasible, compressing raster files, choosing an appropriate format and keeping display sizes close to natural dimensions, and points at the site usage dashboard to see which assets consume the most bandwidth, plus a WebP conversion tool in the Assets panel.
On everything else it is blunter. Limit external resources such as scripts and social feeds, because each one adds load time, and review third-party integrations to update, replace or remove them. On interactions and animation it asks you to use them only where they add real value, reuse the same interaction across elements rather than duplicating it, and apply transitions only to the properties that need to change.
Tags accumulate because adding one is a five minute job and removing one requires knowing who asked for it. List every script on the page, name an owner for each, and remove the ones whose owner has left or whose campaign ended. This is usually the single largest available saving and it needs no development work.
On a recent UK site, the team had spent two sprints on image compression and the field LCP had barely moved. The breakdown showed time to first byte taking most of it, caused by a redirect chain on the primary entry URL that nobody had looked at since a domain change. Removing one hop did more than both sprints had. The images had genuinely been too large; they were simply not the binding constraint. You can see the shape of that work in our case study library.
A change made for real users has to be confirmed on real users, and field data lags by weeks because it accumulates. Teams that re-run a lab test, see a better number and declare victory are measuring the simulation they already knew how to pass. Note the change, the date, and check the field figure a month later.
CLS is about visual stability rather than speed, so it does not improve when a page gets faster. It usually comes from images and embeds without reserved dimensions, or from fonts and banners that arrive late and push content down. More on diagnosing that inside a live project in our writing.
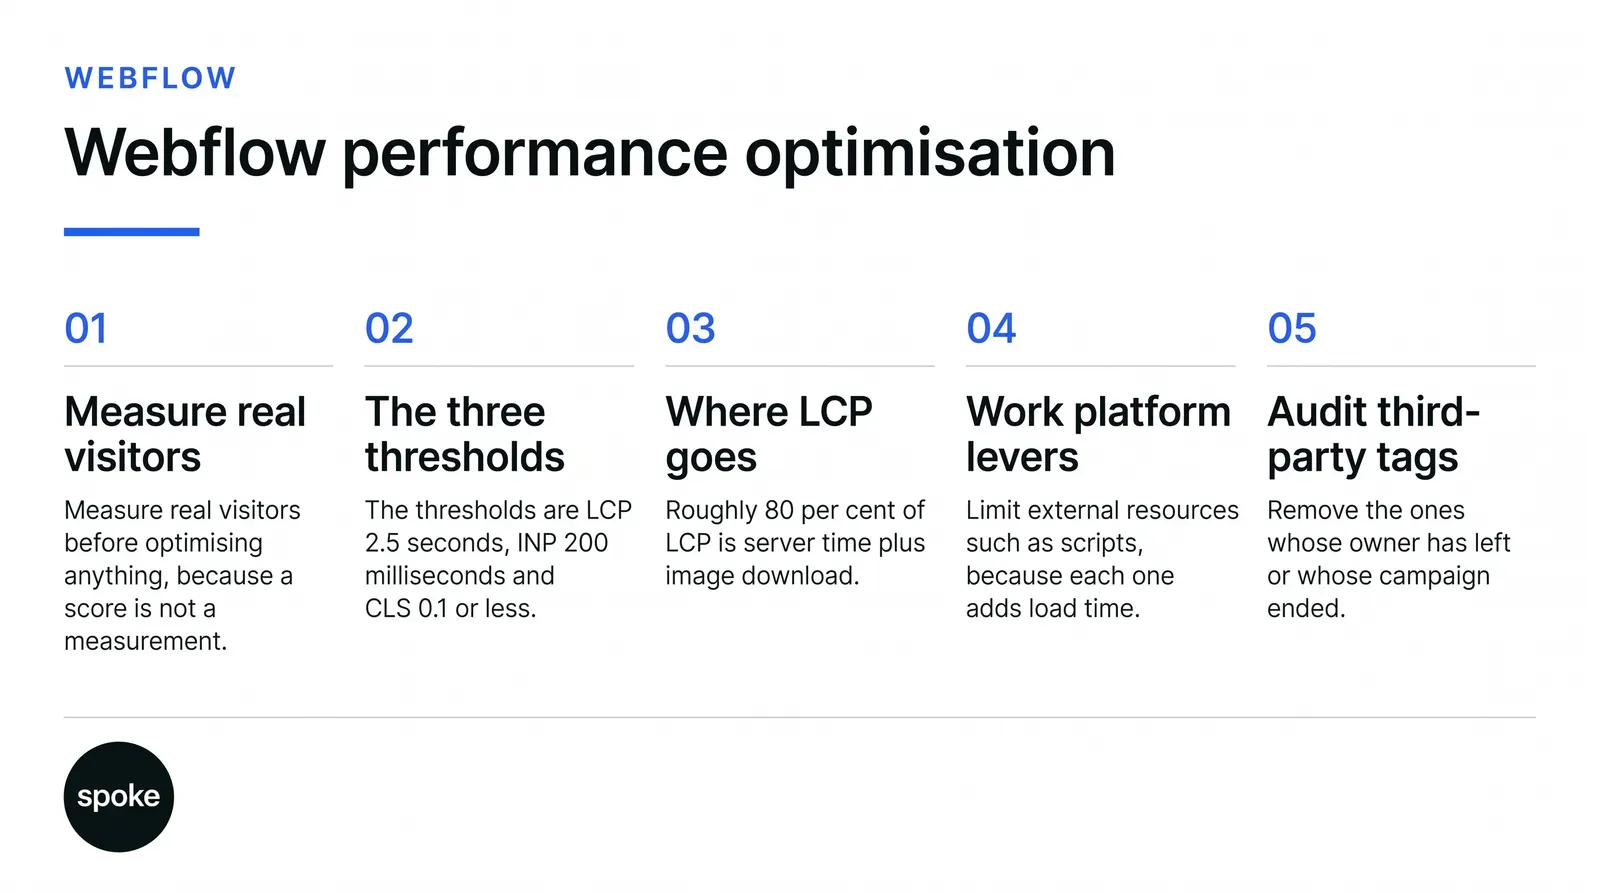
If you are planning performance work, get field data before you write the ticket, because the lab score tells you something is slow and the field data tells you for whom. If you already have field data, break LCP into its four parts before touching anything, since that single step tells you whether the available saving is in the server, the image or the scripts, and those are three different projects. And if you have one afternoon, audit the third-party tags and remove the ones nobody owns, which is usually the largest saving available without a developer. If you want a second opinion on yours, talk to us.
Q. What counts as a good Core Web Vitals result?
Ans. Largest Contentful Paint within 2.5 seconds, Interaction to Next Paint at 200 milliseconds or less, and Cumulative Layout Shift at 0.1 or less. All three are judged at the 75th percentile of page loads and segmented across mobile and desktop, so a page passes only when it meets every threshold for three quarters of real visits on each device class.
Q. Why does our Lighthouse score disagree with our field data?
Ans. Because they measure different things. Lighthouse runs one simulated load on a simulated device, while field data records what happened to real visitors across every device and connection. Google states plainly that lab data is not a substitute for field measurement. Lighthouse also cannot measure Interaction to Next Paint, since no user interacts with the page.
Q. Should we fix images or scripts first?
Ans. Break LCP into its four parts and let the breakdown decide. Image download and time to first byte each account for roughly 40 per cent of LCP, with load delay and render delay under 10 per cent apiece. If server time dominates, image work will not move the result. Those shares are guidelines rather than fixed budgets.
Q. How long before a change shows up?
Ans. Field data accumulates over a rolling window, so expect weeks rather than days before a fix is visible in the numbers. Record what changed and when, so you can attribute the movement later. Re-running a lab test immediately after a deploy confirms that the change shipped, which is not the same as confirming it helped anyone.
Q. What should a webflow web design agency be responsible for here?
Ans. Build-side decisions that set the ceiling: image handling, how components are structured, whether interactions are reused or duplicated, and keeping render-blocking resources out of the head. What sits with you is the third-party tag list, since those are usually added by marketing after handover and are the most common cause of a result degrading quietly.
Let’s Connect.
Have a project in mind or want to explore how we can help your business grow?